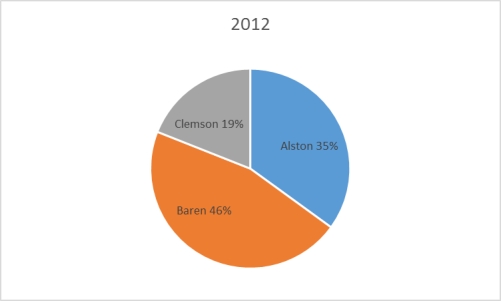
The 2010 and 2012 market share data of the three competitors (Alston,Baren,and Clemson) in an oligopolistic industry are presented in the following pie charts.Total sales for this industry were $1.5 billion in 2010 and $1.8 billion in 2012. Baren's sales in 2010 were ___________. 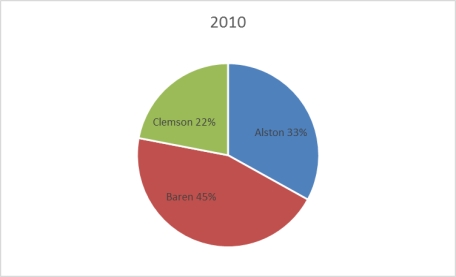
A) $342 million
B) $630 million
C) $675 million
D) $828 million
E) $928 million
Correct Answer:
Verified
Q39: A recent survey of U.S.automobile owners showed
Q40: An instructor has decided to graphically represent
Q41: According to the following graphic,"Bent Pins" account
Q42: The following graphic of residential housing data
Q43: According to the following graphic,the most common
Q45: The 2010 and 2012 market share data
Q46: The 2010 and 2012 market share data
Q47: The following graphic of residential housing data
Q48: The 2010 and 2012 market share data
Q49: The following graphic of PCB Failures is
Unlock this Answer For Free Now!
View this answer and more for free by performing one of the following actions

Scan the QR code to install the App and get 2 free unlocks

Unlock quizzes for free by uploading documents