The following graphic of PCB Failures is a _____________. 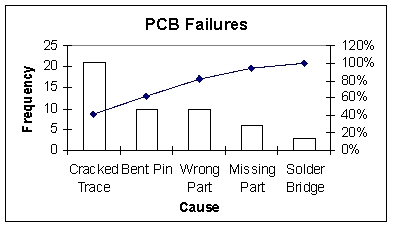
A) Scatter Plot
B) Pareto Chart
C) Pie Chart
D) Cumulative Histogram Chart
E) Line diagram
Correct Answer:
Verified
Q44: The 2010 and 2012 market share data
Q45: The 2010 and 2012 market share data
Q46: The 2010 and 2012 market share data
Q47: The following graphic of residential housing data
Q48: The 2010 and 2012 market share data
Q50: The following is a bar chart of
Q51: Suppose a market survey of 200 consumers
Q52: The following graphic of cigarettes smoked (sold)per
Q53: Suppose a market survey of 200 consumers
Q54: The United Nations Development Programme website provides
Unlock this Answer For Free Now!
View this answer and more for free by performing one of the following actions

Scan the QR code to install the App and get 2 free unlocks

Unlock quizzes for free by uploading documents