The 2010 and 2012 market share data of the three competitors (Alston,Baren,and Clemson) in an oligopolistic industry are presented in the following pie charts. 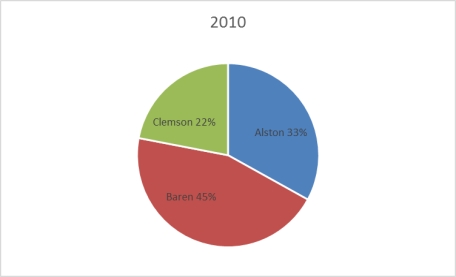
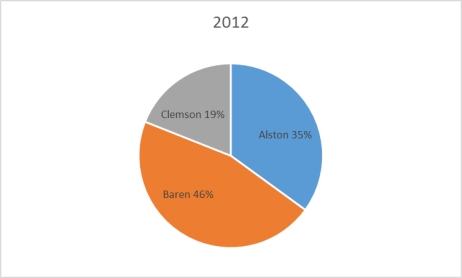 Which of the following is true?
A) Only Baren share.
B) Only Clemson lost market share.
C) Alston lost market share.
D) Baren lost market share.
E) All companies lost market share
Correct Answer:
Verified
Q40: An instructor has decided to graphically represent
Q41: According to the following graphic,"Bent Pins" account
Q42: The following graphic of residential housing data
Q43: According to the following graphic,the most common
Q44: The 2010 and 2012 market share data
Q46: The 2010 and 2012 market share data
Q47: The following graphic of residential housing data
Q48: The 2010 and 2012 market share data
Q49: The following graphic of PCB Failures is
Q50: The following is a bar chart of
Unlock this Answer For Free Now!
View this answer and more for free by performing one of the following actions

Scan the QR code to install the App and get 2 free unlocks

Unlock quizzes for free by uploading documents