The following graphic of residential housing data (selling price and size in square feet) indicates _____________. 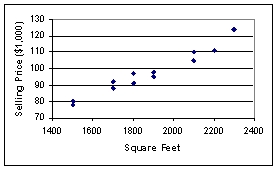
A) an inverse relation between the two variables
B) no relation between the two variables
C) a direct relation between the two variables
D) a negative exponential relation between the two variables
E) a sinusoidal relationship between the two variables
Correct Answer:
Verified
Q25: The cumulative frequency for a class is
Q37: The staff of Mr.Wayne Wertz,VP of Operations
Q39: A recent survey of U.S.automobile owners showed
Q40: An instructor has decided to graphically represent
Q41: According to the following graphic,"Bent Pins" account
Q43: According to the following graphic,the most common
Q44: The 2010 and 2012 market share data
Q45: The 2010 and 2012 market share data
Q46: The 2010 and 2012 market share data
Q47: The following graphic of residential housing data
Unlock this Answer For Free Now!
View this answer and more for free by performing one of the following actions

Scan the QR code to install the App and get 2 free unlocks

Unlock quizzes for free by uploading documents