Construct a scatter diagram for the data.
-The data below are the temperatures on randomly chosen days during a summer class and the number of absences on those days. 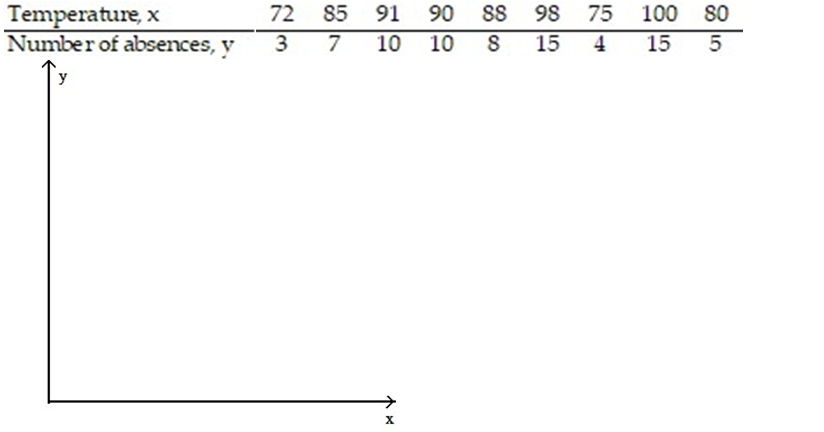
Correct Answer:
Verified
Q2: Construct a scatter diagram for the data.
-The
Q3: Construct a scatter diagram for the data.
-In
Q4: Construct a scatter diagram for the data.
-Five
Q5: Construct a scatter diagram for the data.
-The
Q6: Make a scatter diagram for the data.
Q7: Make a scatter diagram for the data.
Q8: Make a scatter diagram for the data.
Q9: Use the scatter diagrams shown, labeled a
Q10: The data below represent the numbers of
Q11: A medical researcher wishes to determine if
Unlock this Answer For Free Now!
View this answer and more for free by performing one of the following actions

Scan the QR code to install the App and get 2 free unlocks

Unlock quizzes for free by uploading documents