Construct a scatter diagram for the data.
-Five brands of cigarettes were tested for the amounts of tar and nicotine they contained. All measurements are in milligrams per cigarette. 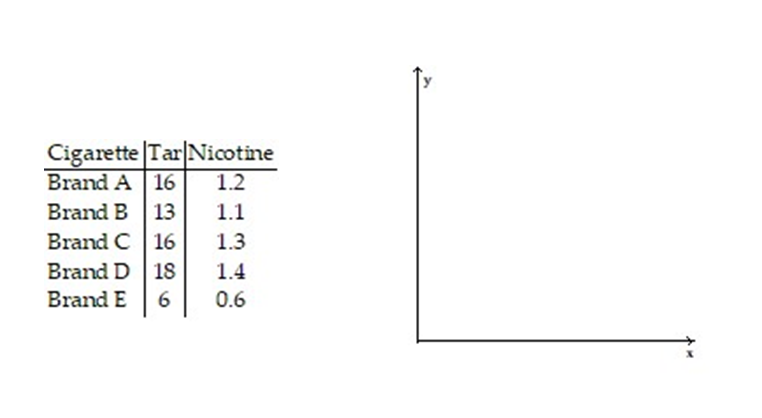
Correct Answer:
Verified
Q1: Construct a scatter diagram for the data.
-The
Q2: Construct a scatter diagram for the data.
-The
Q3: Construct a scatter diagram for the data.
-In
Q5: Construct a scatter diagram for the data.
-The
Q6: Make a scatter diagram for the data.
Q7: Make a scatter diagram for the data.
Q8: Make a scatter diagram for the data.
Q9: Use the scatter diagrams shown, labeled a
Q10: The data below represent the numbers of
Q11: A medical researcher wishes to determine if
Unlock this Answer For Free Now!
View this answer and more for free by performing one of the following actions

Scan the QR code to install the App and get 2 free unlocks

Unlock quizzes for free by uploading documents