The data below represent the numbers of absences and the final grades of 15 randomly selected students from an astronomy class. Construct a scatter diagram for the data. Do you detect a trend? 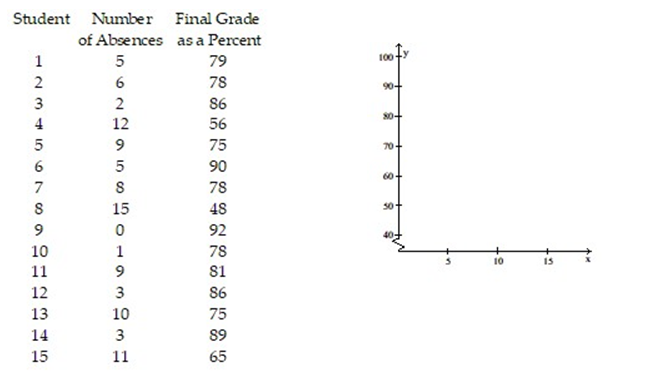
Correct Answer:
Verified
View Answer
Unlock this answer now
Get Access to more Verified Answers free of charge
Q5: Construct a scatter diagram for the data.
-The
Q6: Make a scatter diagram for the data.
Q7: Make a scatter diagram for the data.
Q8: Make a scatter diagram for the data.
Q9: Use the scatter diagrams shown, labeled a
Q11: A medical researcher wishes to determine if
Q12: A history instructor has given the same
Q13: A traffic officer is compiling information about
Q14: Calculate the linear correlation coefficient for the
Q15: Calculate the linear correlation coefficient for the
Unlock this Answer For Free Now!
View this answer and more for free by performing one of the following actions

Scan the QR code to install the App and get 2 free unlocks

Unlock quizzes for free by uploading documents