Refer to the figure.
Figure 9
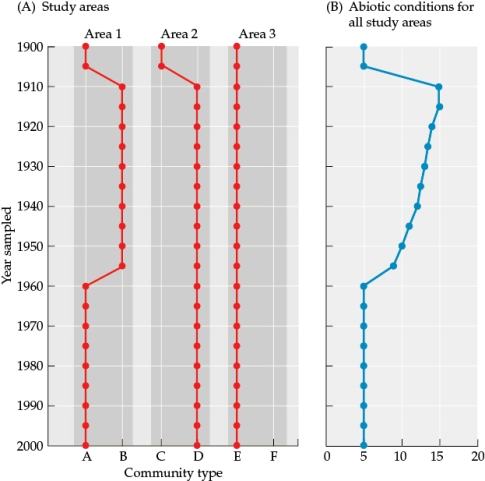 You are studying disturbance and succession patterns, focusing on data you collect in area 1, area 2, and area 3. Part A of the figure shows how the community type changed across each year sampled, and part B shows how the abiotic conditions changed across study years (no specific condition specified or units listed).
- According to the data in Figure 9, which area had the most stable community type in comparison to the changes in the abiotic conditions? Justify your answer.
Correct Answer:
Verified
View Answer
Unlock this answer now
Get Access to more Verified Answers free of charge
Q48: Refer to the figure.
Figure 1

Q49: Refer to the figures.
Figure 1
Q50: Refer to the figures.
Figure 5
Q51: Refer to the figures.
Figure 5
Q52: Refer to the figure.
Figure 9
Q54: Refer to the figure.
Figure 9
Q55: Refer to the tables and the figure.
Q56: Refer to the figure.
Figure 10
Q57: Refer to the figure.
Figure 10
Q58: Refer to the tables and the figure.
Unlock this Answer For Free Now!
View this answer and more for free by performing one of the following actions

Scan the QR code to install the App and get 2 free unlocks

Unlock quizzes for free by uploading documents