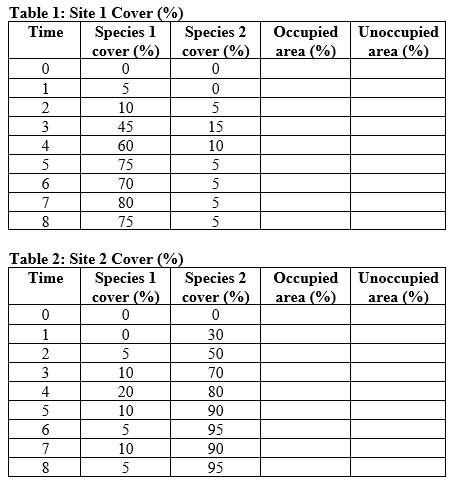
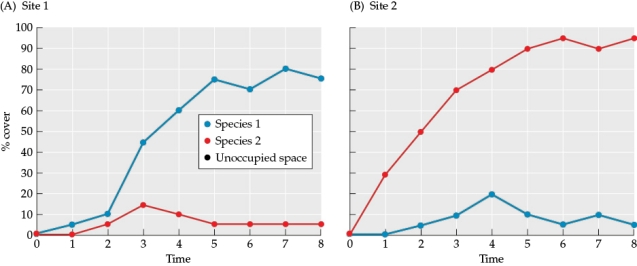
Refer to the tables and the figure.
 Figure 10
 You are studying succession and colonization at two sites, site 1 and site 2. You sample the abundance of two species at the sites and determine their percent cover at each site and time period. Your data are shown in Tables 1 and 2 and are graphed in Figure 10.Answer the following questions:
a) Based on percent cover of species 1 and species 2 at each site, determine the percent of space that is both occupied and unoccupied at each site for each time period. Enter the data into Tables 1 and 2 to create two new tables (these will be referred to as Tables 3 and 4).
b) Using the data in Tables 1 and 2, add lines to the graphs in Figure 10 to plot how the percent of unoccupied space changed over time at both sites (this will be referred to as Figure 11).
c) Using the data in Figure 10, create a table (this will be referred to as Table 5) with summary data on each site. Answer each question for each site.
• How much biomass was present at time 0?
• Which species was the earlier colonist?
• What type of succession occurred early in the study period?
• Which species is dominant at time 8?
• When is the total amount of available area fully utilized by the species at each site?
Correct Answer:
Verified
Fi...
View Answer
Unlock this answer now
Get Access to more Verified Answers free of charge
Q50: Refer to the figures.
Figure 5

Q51: Refer to the figures.
Figure 5

Q52: Refer to the figure.
Figure 9

Q53: Refer to the figure.
Figure 9

Q54: Refer to the figure.
Figure 9

Q56: Refer to the figure.
Figure 10
Q57: Refer to the figure.
Figure 10

Q58: Refer to the tables and the figure.
Q59: A mudslide kills a large fraction of
Q60: What type of disturbance regime is most
Unlock this Answer For Free Now!
View this answer and more for free by performing one of the following actions

Scan the QR code to install the App and get 2 free unlocks

Unlock quizzes for free by uploading documents