Refer to the figure.
Figure 9
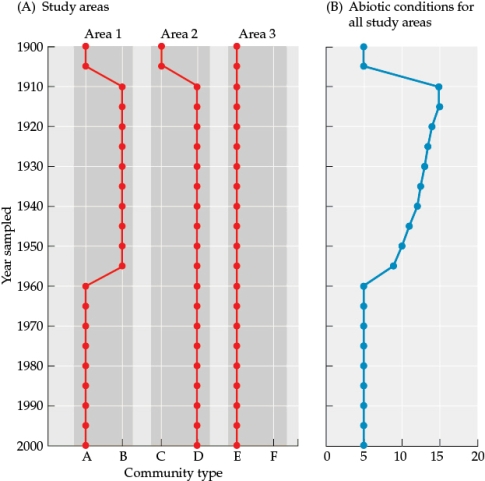 You are studying disturbance and succession patterns, focusing on data you collect in area 1, area 2, and area 3. Part A of the figure shows how the community type changed across each year sampled, and part B shows how the abiotic conditions changed across study years (no specific condition specified or units listed).
-Answer the following questions:
a) According to the data in in Figure 9, when did the disturbance occur?
b) Which years would provide baseline data for these communities? Why is baseline data important?
c) How many years did it take the abiotic conditions to return to levels similar to their original conditions?
d) How many years did it take for the biotic communities in areas 1, 2, and 3 to return to their original conditions?
Correct Answer:
Verified
b) ...
View Answer
Unlock this answer now
Get Access to more Verified Answers free of charge
Q47: Which statement about plants with nitrogen-fixing bacteria
Q48: Refer to the figure.
Figure 1

Q49: Refer to the figures.
Figure 1
Q50: Refer to the figures.
Figure 5
Q51: Refer to the figures.
Figure 5
Q53: Refer to the figure.
Figure 9
Q54: Refer to the figure.
Figure 9
Q55: Refer to the tables and the figure.
Q56: Refer to the figure.
Figure 10
Q57: Refer to the figure.
Figure 10
Unlock this Answer For Free Now!
View this answer and more for free by performing one of the following actions

Scan the QR code to install the App and get 2 free unlocks

Unlock quizzes for free by uploading documents