Refer to the figure.
Figure 1
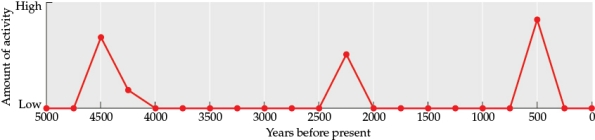 You are studying succession in an area affected by a volcanic eruption. Figure 1 shows the amount of volcanic activity over time, from no activity to high activity. Time periods with no activity indicate that the volcano is inactive and no disturbance is occurring; time periods with high activity indicate that the volcano is active and there are high levels of disturbance.Answer the following questions:
a) How would you describe the frequency of eruptions in terms of ecological timescales? Are eruptions common or rare in this area compared to the lifespan of organisms?
b) Using the frequency of eruptions, create a graph (this will be referred to as Figure 2) that shows where this type of event would be located on the plot of the spectrum of disturbance. Make the x-axis frequency (from low to high), and the y-axis intensity (from low to high).
c) Based on the frequency and intensity of the eruptions, what type of successional response would you predict for this area?
Correct Answer:
Verified
View Answer
Unlock this answer now
Get Access to more Verified Answers free of charge
Q43: Which human activity can bring about shifts
Q44: Which statement about the amphibians that colonized
Q45: In the succession that followed the eruption
Q46: Plants with bacterial symbionts that fix _
Q47: Which statement about plants with nitrogen-fixing bacteria
Q49: Refer to the figures.
Figure 1

Q50: Refer to the figures.
Figure 5
Q51: Refer to the figures.
Figure 5
Q52: Refer to the figure.
Figure 9
Q53: Refer to the figure.
Figure 9
Unlock this Answer For Free Now!
View this answer and more for free by performing one of the following actions

Scan the QR code to install the App and get 2 free unlocks

Unlock quizzes for free by uploading documents