Use the graph to answer the question.
-This double-bar graph shows the number of male (M)and female (F)athletes at a
university over a four-year period. 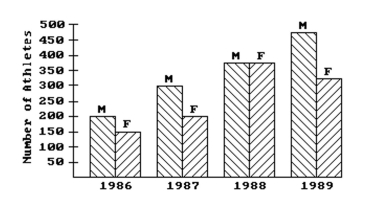 Compare the trend in the number of male athletes during the four-year period and the
trend in the number of female athletes during the four-year period .
Correct Answer:
Verified
View Answer
Unlock this answer now
Get Access to more Verified Answers free of charge
Q89: Use the graph to answer the question.
-The
Q90: Use the indicated bin size to
Q91: Use the graph to answer the question.
-
Q92: Create a graphical display for the
Q93: Describe how you would apply the five
Q95: Use the graph to answer the question.
-The
Q96: Provide an appropriate response.
-Shortly before an
Q97: Provide an appropriate response.
-Consider the frequency
Q98: Use the guidelines to evaluate the study.
Q99: Use the indicated bin size to
Unlock this Answer For Free Now!
View this answer and more for free by performing one of the following actions

Scan the QR code to install the App and get 2 free unlocks

Unlock quizzes for free by uploading documents