Use the graph to answer the question.
-The following time-series diagram tracks the performance of two stocks during the month
of October. 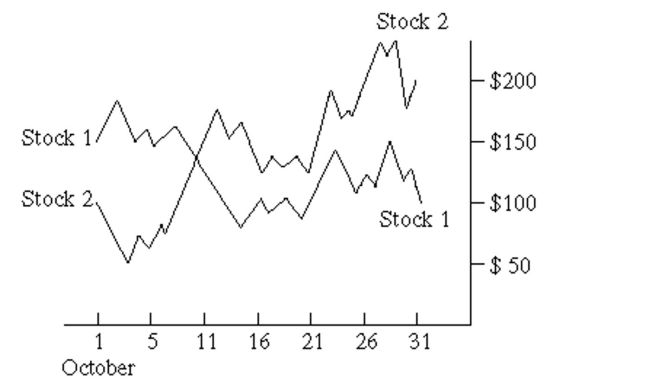 Describe the overall trend in the value of each stock during the month of October. By what
percentage did the value of each stock increase or decrease during the month of October?
Correct Answer:
Verified
View Answer
Unlock this answer now
Get Access to more Verified Answers free of charge
Q90: Use the indicated bin size to
Q91: Use the graph to answer the question.
-
Q92: Create a graphical display for the
Q93: Describe how you would apply the five
Q94: Use the graph to answer the question.
-This
Q96: Provide an appropriate response.
-Shortly before an
Q97: Provide an appropriate response.
-Consider the frequency
Q98: Use the guidelines to evaluate the study.
Q99: Use the indicated bin size to
Q100: Provide an appropriate response.
-Shortly before a
Unlock this Answer For Free Now!
View this answer and more for free by performing one of the following actions

Scan the QR code to install the App and get 2 free unlocks

Unlock quizzes for free by uploading documents