Use the graph to answer the question.
-The time series line chart below shows the price of a volatile stock from January to
December of the same year. Describe the overall trend in the price during that period. 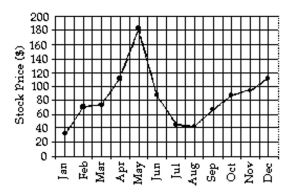
Correct Answer:
Verified
View Answer
Unlock this answer now
Get Access to more Verified Answers free of charge
Q84: Use the indicated bin size to
Q85: Create a graphical display for the
Q86: Use the guidelines to evaluate the study.
Q87: Answer the question.
-A television manufacturer sold three
Q88: Use the guidelines to evaluate the study.
Q90: Use the indicated bin size to
Q91: Use the graph to answer the question.
-
Q92: Create a graphical display for the
Q93: Describe how you would apply the five
Q94: Use the graph to answer the question.
-This
Unlock this Answer For Free Now!
View this answer and more for free by performing one of the following actions

Scan the QR code to install the App and get 2 free unlocks

Unlock quizzes for free by uploading documents