Use the graph to answer the question.
-The bar graph below shows the relative frequencies of the different blood types. Write a
sentence describing what is revealed by the graph. 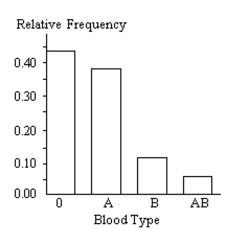
Correct Answer:
Verified
View Answer
Unlock this answer now
Get Access to more Verified Answers free of charge
Q56: The graph below shows estimated world
Q57: The graph below shows estimated world
Q58: Answer the question.
-Which of the following describes
Q59: Describe how you would apply the five
Q60: In order to answer the given question,
Q62: Solve the problem.
-A researcher finds a negative
Q63: Answer the question.
-Andrew creates a bar
Q64: Answer the question.
-The bar graph below shows
Q65: Construct the specified histogram.
-30 police detectives
Q66: Answer the question.
-The bar graph below shows
Unlock this Answer For Free Now!
View this answer and more for free by performing one of the following actions

Scan the QR code to install the App and get 2 free unlocks

Unlock quizzes for free by uploading documents