Answer the question.
-The bar graph below shows the average cost of renting a studio in a certain city in each of
the years 1994 through 1998. 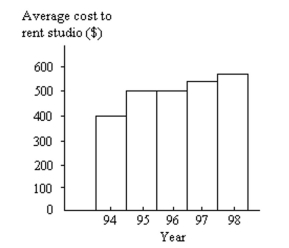 By what percentage does the average rental price increase from 1994 to 1995? Obtain a
truncated version of the graph by sliding a piece of paper over the bottom portion of the
graph so that the scale on the vertical axis starts at 300. In the truncated graph, by what
percentage does the price appear to increase from 1994 to 1995? Why is the truncated
graph misleading?
Correct Answer:
Verified
View Answer
Unlock this answer now
Get Access to more Verified Answers free of charge
Q61: Use the graph to answer the question.
-The
Q62: Solve the problem.
-A researcher finds a negative
Q63: Answer the question.
-Andrew creates a bar
Q64: Answer the question.
-The bar graph below shows
Q65: Construct the specified histogram.
-30 police detectives
Q67: Describe how you would apply the five
Q68: Make a bar graph to represent
Q69: Use the guidelines to evaluate the study.
Q70: Describe how you would apply the five
Q71: Create a graphical display for the
Unlock this Answer For Free Now!
View this answer and more for free by performing one of the following actions

Scan the QR code to install the App and get 2 free unlocks

Unlock quizzes for free by uploading documents