Answer the question.
-The bar graph below shows the number of car accidents occurring in one city in each of the
years 1993 through 1998. The number of accidents dropped in 1995 after a new speed limit
was imposed. Why is the graph misleading? How would you redesign the graph so that it
is less misleading? What impression is conveyed by the graph? 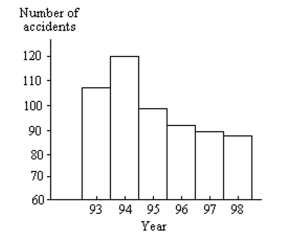
Correct Answer:
Verified
View Answer
Unlock this answer now
Get Access to more Verified Answers free of charge
Q59: Describe how you would apply the five
Q60: In order to answer the given question,
Q61: Use the graph to answer the question.
-The
Q62: Solve the problem.
-A researcher finds a negative
Q63: Answer the question.
-Andrew creates a bar
Q65: Construct the specified histogram.
-30 police detectives
Q66: Answer the question.
-The bar graph below shows
Q67: Describe how you would apply the five
Q68: Make a bar graph to represent
Q69: Use the guidelines to evaluate the study.
Unlock this Answer For Free Now!
View this answer and more for free by performing one of the following actions

Scan the QR code to install the App and get 2 free unlocks

Unlock quizzes for free by uploading documents