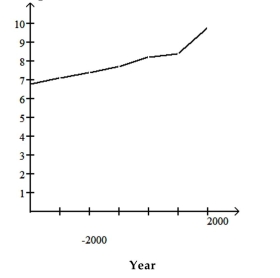
The graph below shows estimated world population for the period 4000 BC =2000 AD. Note that the logarithm of the world population and not actual population is plotted on the vertical axis. This means, for example, that when the graph reaches 7 on the vertical scale, world population is and when the graph reaches 9 on the vertical scale, worldpopulation is .
Log World Population  Use the graph to answer the question.
-Describe the general trend in world population during the period 2000 BC to the year 1 AD.
A) World population increases at a slower and slower rate.
B) World population increases at a constant rate.
C) World population is constant.
D) World population increases at a faster and faster rate.
Correct Answer:
Verified
Q52: Use the guidelines to evaluate the study.
Q53: Answer as requested.
-In studying the relationship between
Q54: Answer as requested.
-Which of the following pairs
Q55: Choose the best wording for the question
Q56: The graph below shows estimated world
Q58: Answer the question.
-Which of the following describes
Q59: Describe how you would apply the five
Q60: In order to answer the given question,
Q61: Use the graph to answer the question.
-The
Q62: Solve the problem.
-A researcher finds a negative
Unlock this Answer For Free Now!
View this answer and more for free by performing one of the following actions

Scan the QR code to install the App and get 2 free unlocks

Unlock quizzes for free by uploading documents