Consider the following three figures, which show the Phillips curve relationship for the 1970s, 1980s, and 1990s. The output gap is on the x-axis and the change in inflation, , is on the y-axis. Explain what each of these Phillips curves tells us about each of the three decades. In which period would fighting inflation be the most difficult?Figure 9.9: Phillips Curve Relationship, 1970s 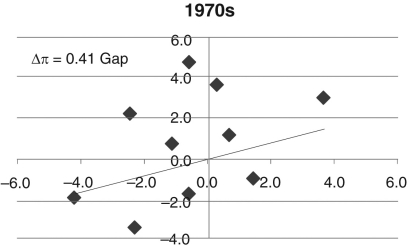
Figure 9.10: Phillips Curve Relationship, 1980s 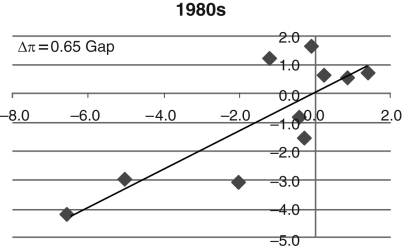
Figure 9.11: Phillips Curve Relationship, 1990s 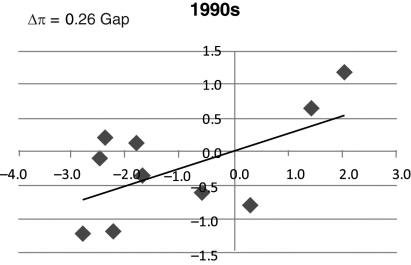
Correct Answer:
Verified
View Answer
Unlock this answer now
Get Access to more Verified Answers free of charge
Q103: An increase in planned investment expenditures is
Q104: You are given the U.S. employment data
Q105: How is a recession "officially" determined?
Q106: A country with a steep Phillips curve
Q107: Figure 9.8: Cyclical Unemployment: 1980-2015 
Q108: A decline in long-term productivity implies that
Q110: What does the Phillips curve represent?
Q111: What does Okun's law state?
Q112: Figure 9.7: The Output Gap 1980-2015
Q113: When current output rises above potential output,
Unlock this Answer For Free Now!
View this answer and more for free by performing one of the following actions

Scan the QR code to install the App and get 2 free unlocks

Unlock quizzes for free by uploading documents