You are given the U.S. employment data in Figure 9.3 below by your uncle, and he is curious to know what was happening to the economy in 1996-2000 and 2007-2009. You might not remember, but you tell him you can explain what happened to the employment rate, the output gap, and inflation. What do you tell him? Your uncle likes economics, so some mathematical relationships would probably help your argument.Figure 9.3: Percent Change in U.S. Employment: 1980-2015 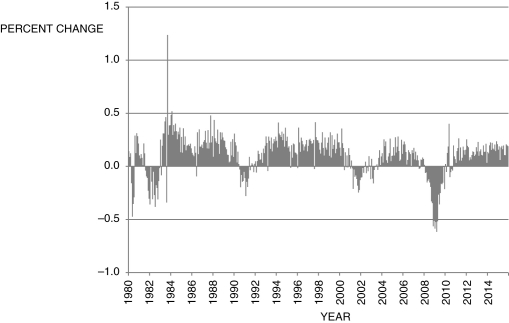
Correct Answer:
Verified
View Answer
Unlock this answer now
Get Access to more Verified Answers free of charge
Q99: You are a staff economist with the
Q100: According to the Phillips curve presented in
Q101: What three premises does the short-run model
Q102: If output is above potential, so that
Q103: An increase in planned investment expenditures is
Q105: How is a recession "officially" determined?
Q106: A country with a steep Phillips curve
Q107: Figure 9.8: Cyclical Unemployment: 1980-2015 
Q108: A decline in long-term productivity implies that
Q109: Consider the following three figures, which
Unlock this Answer For Free Now!
View this answer and more for free by performing one of the following actions

Scan the QR code to install the App and get 2 free unlocks

Unlock quizzes for free by uploading documents