Figure 9.7: The Output Gap 1980-2015 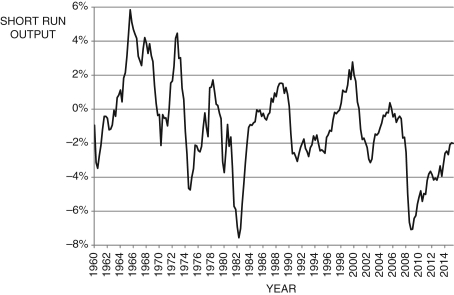 (Source: Federal Reserve Economic Data, St. Louis Federal Reserve)
-Figure 9.7 above shows the output gap for the years 1960-2015. Using the Phillips curve and Okun's law, discuss the impacts on inflation and unemployment for the years 1997-2000 and 2008-2015. From this analysis, what is the relationship between unemployment and inflation?
Correct Answer:
Verified
View Answer
Unlock this answer now
Get Access to more Verified Answers free of charge
Q103: An increase in planned investment expenditures is
Q104: You are given the U.S. employment data
Q105: How is a recession "officially" determined?
Q106: A country with a steep Phillips curve
Q107: Figure 9.8: Cyclical Unemployment: 1980-2015 
Q108: A decline in long-term productivity implies that
Q109: Consider the following three figures, which
Q110: What does the Phillips curve represent?
Q111: What does Okun's law state?
Q113: When current output rises above potential output,
Unlock this Answer For Free Now!
View this answer and more for free by performing one of the following actions

Scan the QR code to install the App and get 2 free unlocks

Unlock quizzes for free by uploading documents