Multiple Choice
The accompanying graph 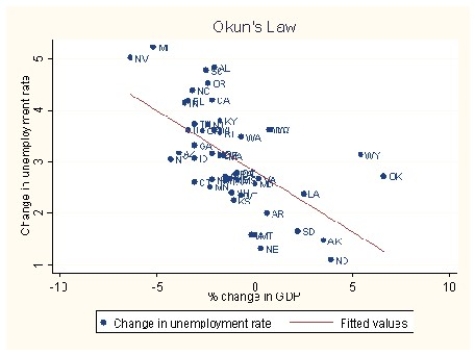 Is an example of
A) cross-sectional data.
B) experimental data.
C) a time series.
D) longitudinal data.
Correct Answer:
Verified
Related Questions
Q2: Studying inflation in the United States from
Q4: Econometrics can be defined as follows with
Q5: Panel data
A)is also called longitudinal data.
B)is the
Q8: In the graph below,the vertical axis represents
Q9: Analyzing the behavior of unemployment rates across
Q10: The most frequently used experimental or observational
Unlock this Answer For Free Now!
View this answer and more for free by performing one of the following actions

Scan the QR code to install the App and get 2 free unlocks

Unlock quizzes for free by uploading documents