In the graph below,the vertical axis represents average real GDP growth for 65 countries over the period 1960-1995,and the horizontal axis shows the average trade share within these countries. 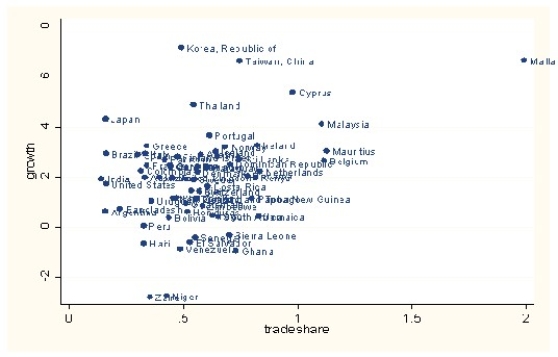 This is an example of
A) cross-sectional data.
B) experimental data.
C) a time series.
D) longitudinal data.
Correct Answer:
Verified
Q3: Give at least three examples from economics
Q4: Econometrics can be defined as follows with
Q5: Panel data
A)is also called longitudinal data.
B)is the
Q6: Ideal randomized controlled experiments in economics are
A)often
Q10: The most frequently used experimental or observational
Unlock this Answer For Free Now!
View this answer and more for free by performing one of the following actions

Scan the QR code to install the App and get 2 free unlocks

Unlock quizzes for free by uploading documents