Looking at the distribution of data on the bar chart below, how best can it be described? 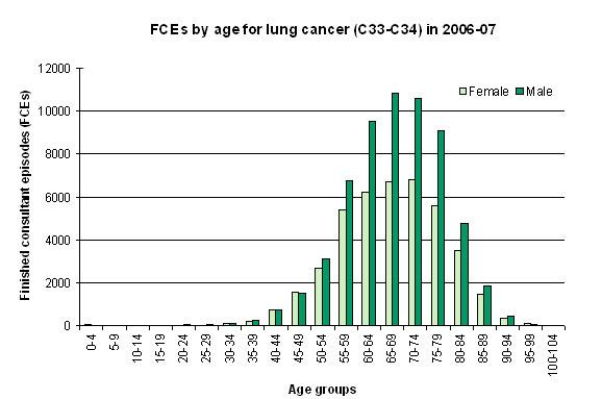
A) Normally distributed
B) Negatively skewed
C) Positively skewed
D) Leptokurtic
Correct Answer:
Verified
Q1: To answer this question visit HYPERLINK "http://www.performance.doh.gov.uk/hospitalactivity/data_requests/download/total_time_ae/ae_08_q4_pt3.xls"
Q2: Quantitative research involves the use of which
Q3: What does the data in the chart
Q4: The research process is comprised of five
Q5: To answer this question visit HYPERLINK "http://www.performance.doh.gov.uk/hospitalactivity/data_requests/download/total_time_ae/ae_08_q4_pt3.xls"
Q6: To answer this question visit HYPERLINK "http://www.performance.doh.gov.uk/hospitalactivity/data_requests/download/total_time_ae/ae_08_q4_pt3.xls"
Q7: Based on the following chart, the statement
Q8: To answer this question visit HYPERLINK "http://www.performance.doh.gov.uk/hospitalactivity/data_requests/download/total_time_ae/ae_08_q4_pt3.xls"
Unlock this Answer For Free Now!
View this answer and more for free by performing one of the following actions

Scan the QR code to install the App and get 2 free unlocks

Unlock quizzes for free by uploading documents