The figure given below shows the demand curve faced by a firm. Figure 24.1 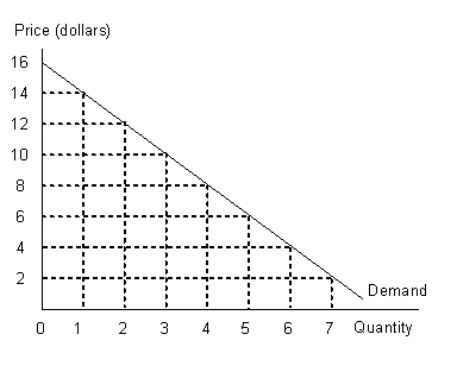 Refer to Figure 24.1 and calculate the revenue lost when the firm lowers the price of its product from $8 to $4.
A) $20
B) $18
C) $24
D) $16
E) $28
Correct Answer:
Verified
Q5: A firm such as a public utility,which
Q12: In many cities the market for cab
Q13: The figure given below shows the aggregate
Q21: The figure given below shows the demand
Q22: The figures given below represent the revenue
Q24: The table given below shows the price
Q25: The table given below shows the prices
Q26: The following table shows the units of
Q27: The table given below shows the prices
Q28: The figures given below represent the revenue
Unlock this Answer For Free Now!
View this answer and more for free by performing one of the following actions

Scan the QR code to install the App and get 2 free unlocks

Unlock quizzes for free by uploading documents