The figures given below represent the revenue curves of a monopolist. Figure 24.2 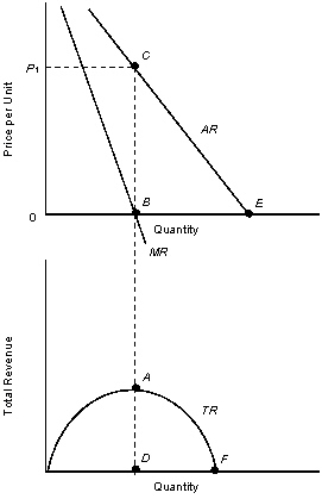 TR: Total revenue curve
AR: Average revenue curve
MR: Marginal revenue curve
Refer to Figure 24.2.In order to maximize profits, what quantity should the monopolist produce?
A) B
B) E
C) Between B and E
D) Impossible to determine because we are not given the cost curves.
E) Impossible to determine because we are not given the demand curve.
Correct Answer:
Verified
Q1: The figure given below shows the aggregate
Q5: A firm such as a public utility,which
Q12: In many cities the market for cab
Q13: The figure given below shows the aggregate
Q21: The figure given below shows the demand
Q23: The figure given below shows the demand
Q24: The table given below shows the price
Q25: The table given below shows the prices
Q26: The following table shows the units of
Q27: The table given below shows the prices
Unlock this Answer For Free Now!
View this answer and more for free by performing one of the following actions

Scan the QR code to install the App and get 2 free unlocks

Unlock quizzes for free by uploading documents