The figures given below represent the revenue curves of a monopolist. Figure 24.2 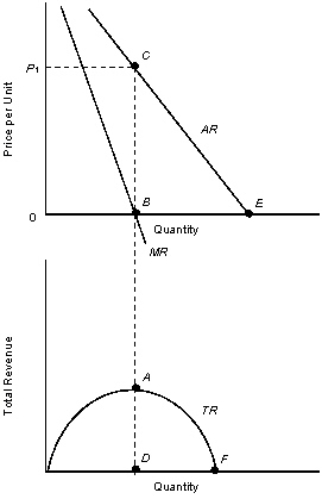 TR: Total revenue curve
AR: Average revenue curve
MR: Marginal revenue curve
According to Figure 24.2, at point C:
A) price elasticity of demand is equal to infinity.
B) price elasticity of supply is equal to 0.
C) price elasticity of supply is equal to 1.
D) price elasticity of demand is equal to 0.
E) price elasticity of demand is equal to 1.
Correct Answer:
Verified
Q23: The figure given below shows the demand
Q23: The figures given below represent the revenue
Q24: The table given below shows the price
Q25: The table given below shows the prices
Q26: The following table shows the units of
Q27: The table given below shows the prices
Q29: The table given below shows the prices
Q31: The table given below shows the price
Q33: The table given below shows the prices
Q34: If a monopolist is producing at a
Unlock this Answer For Free Now!
View this answer and more for free by performing one of the following actions

Scan the QR code to install the App and get 2 free unlocks

Unlock quizzes for free by uploading documents