A table of selected values for a function is given. Also shown are tables of values for the derivative and the accumulation function with 0 as the starting point. Determine which table contains the values of the derivative,  , and which contains the values of the accumulation function,
  . Justify your choice.
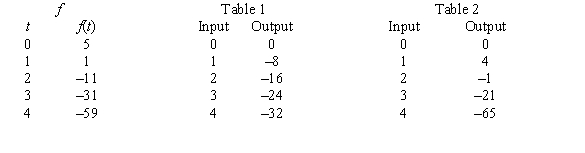
A) Table 1 contains the values of  because f is decreasing and the output values are negative.
Table 2 contains the values of  because its output is close to the cumulative sum of
  .
.
B) Table 1 contains the values of  because f is decreasing and the output values are negative.
Table 2 contains the values of  because
  cannot be negative.
C) Table 1 contains the values of  because its output is close to the cumulative sum of
  .
.
Table 2 contains the values of  because f is decreasing and the output values are negative.
D) Table 1 contains the values of  because the sign of the output does not change.
Table 2 contains the values of  because the output changes sign.
E) Table 1 contains the values of  because the magnitude of the output keeps increasing.
Table 2 contains the values of  because the output changes sign.
Correct Answer:
Verified
Q12: Consider the graph of f(t). 
Q13: The graph of Q14: Suppose the rate of change of the Q15: Consider the graph of the function: Q16: The rate of change of the weight Q18: Consider the graph of r(t), the rate Q19: Consider the graph of the function: Q20: Consider the graph of r(t), the rate Q21: Find the indefinite integral. Q22: Suppose U.S. factory sales of electronic goods![]()
![]()
Unlock this Answer For Free Now!
View this answer and more for free by performing one of the following actions

Scan the QR code to install the App and get 2 free unlocks

Unlock quizzes for free by uploading documents