Suppose the rate of change of the per capita consumption of cottage cheese in the United States between 1980 and 1999 can be modeled by the function 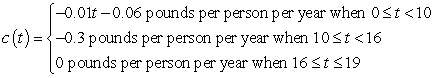 where t is the number of years since 1980. Find the area of the region between the graph and the horizontal axis between
  and
and  . Round your answer to three decimal places.
A) 0.700 pound
B) 2.600 pounds
C) 3.400 pounds
D) 2.900 pounds
E) 9.661 pounds
Correct Answer:
Verified
Q9: Suppose the graph shows the energy usage
Q10: The function Q11: A program to protect a species of Q12: Consider the graph of f(t). ![]()

Unlock this Answer For Free Now!
View this answer and more for free by performing one of the following actions

Scan the QR code to install the App and get 2 free unlocks

Unlock quizzes for free by uploading documents