A program to protect a species of endangered bird is to be phased out by the year 2020. An environmental group has projected the rate of change in the bird population between 2000 and 2020 as shown in the figure below. 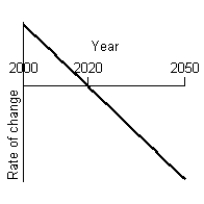 Given that projection, what will a graph of the bird population between 2000 and 2050 look like, using the the following information:
  At the beginning of 2000 there were 1.1 million birds in existence.
  The species will be extinct by 2050.
A) 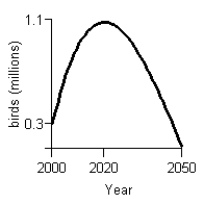
B) 
C) 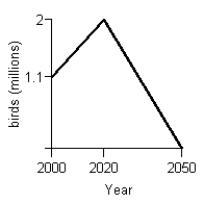
D) 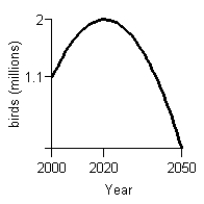
E) 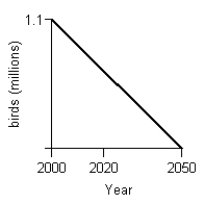
Correct Answer:
Verified
Q6: Using data from the U.S. Bureau of
Q7: Consider the graph of r(t), the rate
Q8: Suppose the rate of change of the
Q9: Suppose the graph shows the energy usage
Q10: The function Q12: Consider the graph of f(t). ![]()

Unlock this Answer For Free Now!
View this answer and more for free by performing one of the following actions

Scan the QR code to install the App and get 2 free unlocks

Unlock quizzes for free by uploading documents