Using data from the U.S. Bureau of the Census, the model 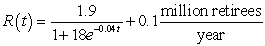 gives the projected rate of change in the number of people within one year of retirement, where t is the number of years since 1940, for the years between 1940 and 2050. Use the equation and ten midpoint rectangles to estimate, to four decimal places, the change in the population within one year of retirement or older from the end of 2037 through the end of 2042.
A) 10.0000 million retirees
B) 7.6075 million retirees
C) 7.5896 million retirees
D) 7.6608 million retirees
E) 7.6783 million retirees
Correct Answer:
Verified
Q1: Given the graph of f(t) 
Q2: Consider the graph of f(t).
Q3: Consider the graph of f(t).
Q4: Scientists can model the change in snow
Q5: Suppose the graph shows the energy usage
Q7: Consider the graph of r(t), the rate
Q8: Suppose the rate of change of the
Q9: Suppose the graph shows the energy usage
Q10: The function Q11: A program to protect a species of![]()
Unlock this Answer For Free Now!
View this answer and more for free by performing one of the following actions

Scan the QR code to install the App and get 2 free unlocks

Unlock quizzes for free by uploading documents