Scientists can model the change in snow depth per day. The graph below shows a model using equivalent centimeters of water per day form April 1 to June 9. Estimate, to the nearest centimeter, the area of the region beneath the curve from May 12 (day 42) to June 9 (day 70) . Interpret your answer. 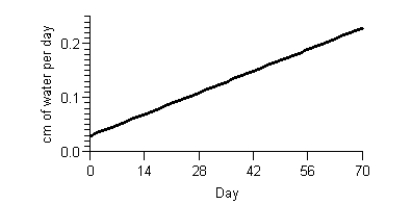
A) Between May 12 (day 42) and June 9 (day 70) , there was snowfall equivalent to approximately 3 centimeters of water.
B) Between May 12 (day 42) and June 9 (day 70) , there was snowfall equivalent to approximately 5 centimeters of water.
C) Between May 12 (day 42) and June 9 (day 70) , each day there was snowfall equivalent to approximately 5 centimeters of water.
D) Between May 12 (day 42) and June 9 (day 70) , each day there was snowfall equivalent to approximately 3 centimeters of water.
E) Between May 12 (day 42) and June 9 (day 70) , there was snowfall equivalent to approximately 2 centimeters of water.
Correct Answer:
Verified
Q1: Given the graph of f(t) 
Q2: Consider the graph of f(t).
Q3: Consider the graph of f(t).
Q5: Suppose the graph shows the energy usage
Q6: Using data from the U.S. Bureau of
Q7: Consider the graph of r(t), the rate
Q8: Suppose the rate of change of the
Q9: Suppose the graph shows the energy usage
Q10: The function Q11: A program to protect a species of![]()
Unlock this Answer For Free Now!
View this answer and more for free by performing one of the following actions

Scan the QR code to install the App and get 2 free unlocks

Unlock quizzes for free by uploading documents