Multiple Choice
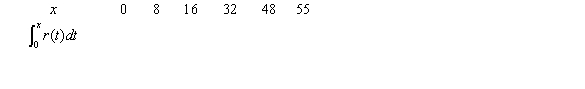
Consider the graph of r(t) , the rate of change in the price of a technology stock, during the first 55 days of trading of 2003. Using the information present below, fill in the accumulation function values in the accompanying table. 

A) 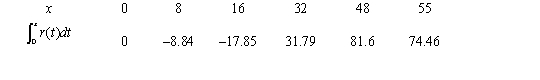
B) 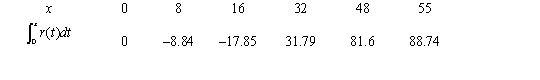
C) 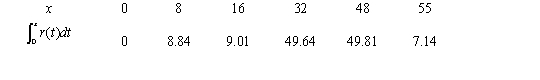
D) 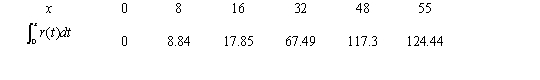
E) 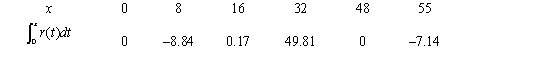
Correct Answer:
Verified
Related Questions
Q15: Consider the graph of the function:
Q16: The rate of change of the weight
Q17: A table of selected values for a
Q18: Consider the graph of r(t), the rate
Q19: Consider the graph of the function:
Unlock this Answer For Free Now!
View this answer and more for free by performing one of the following actions

Scan the QR code to install the App and get 2 free unlocks

Unlock quizzes for free by uploading documents