Before technology was available to fit many kinds of models to data, researchers and others were restricted to using linear models. Because exponential data are common in many fields of study, it has always been important to be able to fit an exponential model to data. Consider the table showing past and predicted populations for a region. Change the data so that they represent the year and natural log of the population. Use the method of least squares to find the best fitting linear model for the changed data where x represents the year. You should keep the data in the form  and should not round the values until the final calculation. Give your coefficients to four decimal places.
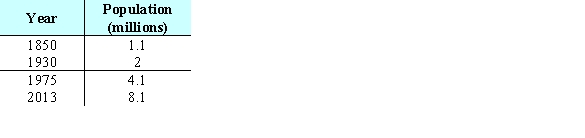
A) 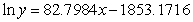
B) 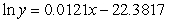
C) 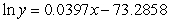
D) 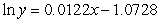
E) 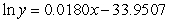
Correct Answer:
Verified
Q40: Let Q41: The table shows the number of days Q42: The table below gives the number of Q43: The table below gives the number of Q44: Consider the table showing the numbers of Q45: For a region, the percentage of adults Q46: A factory makes 7-mm aluminum ball bearings. Q47: The table below gives the number of Q49: For a region, the percentage of adults Q50: The number of animal experiments in a![]()
Unlock this Answer For Free Now!
View this answer and more for free by performing one of the following actions

Scan the QR code to install the App and get 2 free unlocks

Unlock quizzes for free by uploading documents