Multiple Choice
The table below gives the number of inches of precipitation that fell in a city in the given months. Give the linear model  that best fits the data, where x is 1 in January, 2 in February, and 3 in March. Give the coefficients to two decimal places.
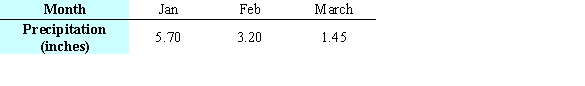
A) 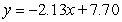
B) 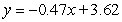
C) 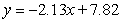
D) 
E) 
Correct Answer:
Verified
Related Questions
Q37: A rancher removed 200 feet of wire
Q38: A manufacture is designing a packaging carton
Q39: The figures show a contour graph for
Unlock this Answer For Free Now!
View this answer and more for free by performing one of the following actions

Scan the QR code to install the App and get 2 free unlocks

Unlock quizzes for free by uploading documents