The table below gives the number of inches of precipitation that fell in a city in the given months. Use the method of least squares to find the multivariable function f with inputs a and b for the best fitting line  where x is 1 in January, 2 in February, and 3 in March.
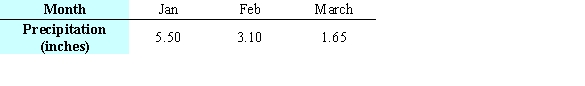
A) 
B) 
C) 
D) 
E) 
Correct Answer:
Verified
Q40: Let Q41: The table shows the number of days Q42: The table below gives the number of Q43: The table below gives the number of Q44: Consider the table showing the numbers of Q45: For a region, the percentage of adults Q46: A factory makes 7-mm aluminum ball bearings. Q48: Before technology was available to fit many Q49: For a region, the percentage of adults Q50: The number of animal experiments in a![]()
Unlock this Answer For Free Now!
View this answer and more for free by performing one of the following actions

Scan the QR code to install the App and get 2 free unlocks

Unlock quizzes for free by uploading documents