The figures show a contour graph for a function f in blue with a constraint function  in black. Estimate any optimal points for the system
 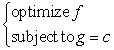 Classify each constrained optimal point as a maximum or a minimum.
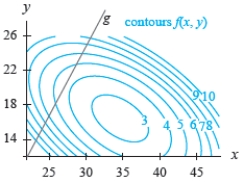
A) (28, 21, 4.5) : constrained minimum
B) (24, 20, 4.5) : constrained minimum
C) (25, 21, 4.5) : constrained minimum
D) (28, 20, 5.5) : constrained maximum
E) (25, 24,3.5) : constrained maximum
Correct Answer:
Verified
Q34: A model for the elevation above sea
Q35: Express SSE as a multivariable function of
Q36: A fitness center is trying to determine
Q37: A rancher removed 200 feet of wire
Q38: A manufacture is designing a packaging carton
Unlock this Answer For Free Now!
View this answer and more for free by performing one of the following actions

Scan the QR code to install the App and get 2 free unlocks

Unlock quizzes for free by uploading documents