Suppose the table shows the average price of certain produce, in cents per pound, for selected months and years. Locate all critical points in the table and identify each point as a relative maximum point, relative minimum point, or a saddle point. 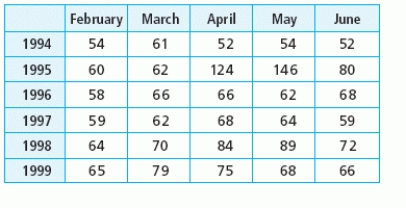
A) relative maximum point(s) : (May 1995) ; (May 1998)
Relative minimum point(s) : (May1996)
Saddle point(s) : (March 1996)
B) relative maximum point(s) (May 1995)
Relative minimum point(s) : (April 1994) and (June 1994)
Saddle point(s) : (March 1996)
C) relative maximum point(s) : (May 1995) ; (May 1998) ; (March 1999)
Relative minimum point(s) : (February 1994) ; (April 1995) ; (June 1994) ; (May 1996) ; (February 1997) ; (June 1997)
Saddle point(s) : (March 1994) ; (May 1994) ; (February 1995) ; (June 1995) ; (March 1996) ; (June 1998)
D) relative maximum point(s) : (May 1995)
Relative minimum point(s) : (April 1994) and (June 1994)
Saddle point(s) : (March 1994) ; (May 1994) ; (February 1995) ; (June 1995) ; (March 1996) ; (June 1998)
E) none of these
Correct Answer:
Verified
Q8: A process to extract pigment from sunflower
Q9: Consider the following contour graph and three-dimensional
Q10: Fatty acids are liberated from a fat
Q11: Is the point Q12: Locate and classify any critical points. Q14: The consistometer table gives the consistency of![]()
Unlock this Answer For Free Now!
View this answer and more for free by performing one of the following actions

Scan the QR code to install the App and get 2 free unlocks

Unlock quizzes for free by uploading documents