Suppose table shows the average price of bananas, in cents per pound, for selected months and years. Locate all relative maximum points, minimum points, and saddle points. 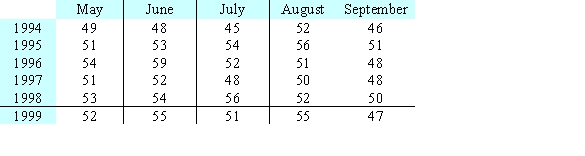
A) none of these
B) relative maximum point(s) : (July 1998) ; (June 1999) ; (August 1999)
Relative minimum points(s) : (July 1994) ; (September 1994) ; (May 1997)
Saddle point(s) : (June 1997) ; (August 1997)
C) relative maximum point(s) : (August, 1995) ; (June 1996)
Relative minimum points(s) : (July 1997) ; (May 1999) ; (July 1999) ; (September 1999)
Saddle point(s) : (May 1998) ; (September 1998)
D) relative maximum point(s) : (June 1996)
Relative minimum points(s) : (July 1997)
Saddle point(s) : (June 1997) ; (August 1997)
E) relative maximum point(s) : (August, 1995) ; (June 1996) ; (July 1998)
Relative minimum points(s) : (July 1997)
Saddle point(s) : (June 1997) ; (August 1997)
Correct Answer:
Verified
Q13: Suppose the table shows the average price
Q14: The consistometer table gives the consistency of
Q15: Suppose that Q16: Consider the contour graph and the three-dimensional Q17: Test for relative maxima and minima. Q19: A nursery sells mulch by the truckload. Q20: Test for relative maxima and minima. Q21: A travel agency offers spring-break cruise packages. Q22: A small percent of homes in an Q23: Write the Lagrange system of partial derivative![]()
Unlock this Answer For Free Now!
View this answer and more for free by performing one of the following actions

Scan the QR code to install the App and get 2 free unlocks

Unlock quizzes for free by uploading documents