Consider the following contour graph and three-dimensional graph for a function F with inputs x and y. On the basis of the graphs approximate the inputs and output of each critical point in the form 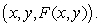
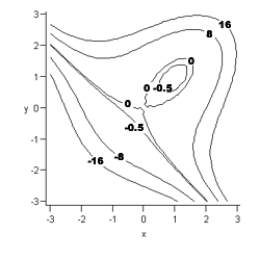
A) relative maximum: none
Relative minimum: (1,1,-5)
Saddle point: (0,0,0)
B) relative maximum: none
Relative minimum: (1,1,-1)
Saddle point: (0,0,0)
C) relative maximum: none
Relative minimum: (1,1,-1)
Saddle point: (0,0,-1)
D) relative maximum: (1,1,-1)
Relative minimum: (-3,-3,-75)
Saddle point: (0,0,-1)
E) relative maximum: (0,0,0)
Relative minimum: (1,1,-1)
Saddle point: none
Correct Answer:
Verified
Q4: A model for the elevation above sea
Q5: A restaurant mixes ground beef that costs
Q6: Consider the contour and associated three-dimensional graph
Q7: Milk proteins are sometimes added to sausage
Q8: A process to extract pigment from sunflower
Q10: Fatty acids are liberated from a fat
Unlock this Answer For Free Now!
View this answer and more for free by performing one of the following actions

Scan the QR code to install the App and get 2 free unlocks

Unlock quizzes for free by uploading documents