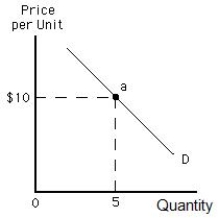
Figure 5.1 shows the demand curve for a firm. In the figure below, the total revenue at point a is _____. Figure 5.1
A) $4
B) $5
C) $10
D) $50
E) $100
Correct Answer:
Verified
Q53: If city officials expect that an increase
Q62: Figure 5.4 shows a downward-sloping linear demand
Q62: One group of people uses New York
Q63: Figure 5.3 shows a linear demand curve.
Q64: Figure 5.5 shows the total revenue curve
Q66: Suppose the price elasticity of demand for
Q69: Figure 5.5 shows the total revenue curve
Q70: Figure 5.2 shows a demand curve. D,
Q80: Along a linear demand curve, as the
Q95: The total revenue curve that corresponds to
Unlock this Answer For Free Now!
View this answer and more for free by performing one of the following actions

Scan the QR code to install the App and get 2 free unlocks

Unlock quizzes for free by uploading documents