Figure 5.2 shows a demand curve. D, the demand curve in the figure below is an example of a(n) :
Figure 5.2.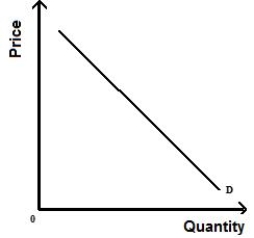
A) upward-sloping demand curve.
B) linear demand curve.
C) perfectly elastic demand curve.
D) unit-elastic demand curve.
E) perfectly inelastic demand curve.
Correct Answer:
Verified
Q42: The total revenue from selling trucks is
Q45: Identify a statement that is true about
Q65: Figure 5.1 shows the demand curve for
Q66: Suppose the price elasticity of demand for
Q69: Figure 5.5 shows the total revenue curve
Q72: Figure 5.4 shows a downward-sloping linear demand
Q74: Which of the following statements is not
Q75: Figure 5.3 shows a linear demand curve.
Q80: Along a linear demand curve, as the
Q95: The total revenue curve that corresponds to
Unlock this Answer For Free Now!
View this answer and more for free by performing one of the following actions

Scan the QR code to install the App and get 2 free unlocks

Unlock quizzes for free by uploading documents