Figure 5.4 shows a downward-sloping linear demand curve. Which of the following is true between points g and h in the figure below?
Figure 5.4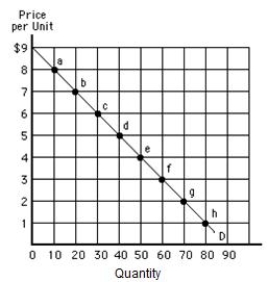
A) Total revenue remains constant at $180
B) Total revenue falls by $12.
C) Total revenue falls by $60.
D) Total revenue falls by $180.
E) Total revenue increases by $300.
Correct Answer:
Verified
Q43: If demand is unit elastic,a price reduction
Q50: If a price reduction leads to an
Q53: If city officials expect that an increase
Q56: If a firm raises the price of
Q62: One group of people uses New York
Q63: Figure 5.3 shows a linear demand curve.
Q64: Figure 5.5 shows the total revenue curve
Q65: Figure 5.1 shows the demand curve for
Q66: Suppose the price elasticity of demand for
Q95: The total revenue curve that corresponds to
Unlock this Answer For Free Now!
View this answer and more for free by performing one of the following actions

Scan the QR code to install the App and get 2 free unlocks

Unlock quizzes for free by uploading documents