Solve the problem.
-The graph depicts a relationship between scores achieved on an unspecified standardized test and family income. Find the slope of the line.
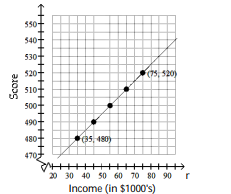
A) 1 point(s) per thousand dollars
B) 1000 point(s) per thousand dollars
C) 100 point(s) per thousand dollars
D) 10.1 point(s) per thousand dollars 
Correct Answer:
Verified
Q107: Decide whether the slope is positive, negative,
Q108: Solve the problem. Q109: Solve the problem. Q110: Solve the problem. Q111: Solve the problem. Q113: Find the slope of the line going Q114: Find the slope of the line going Q115: Find the slope of the line going Q116: Find the slope of the line going Q117: Find the slope of the line going
-![]()
-A hill on a hiking
-Data regarding the amount spent
-Data regarding the amount spent
Unlock this Answer For Free Now!
View this answer and more for free by performing one of the following actions

Scan the QR code to install the App and get 2 free unlocks

Unlock quizzes for free by uploading documents