Solve the problem.
-Data regarding the amount spent by a government department is represented in the following graph. Find the slope of the line by using any two of the points shown on the line. Is the slope equal to the yearly change in amount spent?
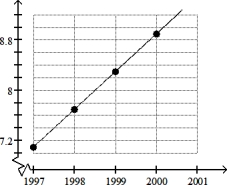
Year
A) Slope: $0.15 billion; no
B) Slope: $0.6 billion; yes
C) Slope: $0.35 billion; yes
D) Slope: $0.25 billion; no
Correct Answer:
Verified
Q106: Decide whether the slope is positive, negative,
Q107: Decide whether the slope is positive, negative,
Q108: Solve the problem. Q109: Solve the problem. Q110: Solve the problem. Q112: Solve the problem. Q113: Find the slope of the line going Q114: Find the slope of the line going Q115: Find the slope of the line going Q116: Find the slope of the line going
-![]()
-A hill on a hiking
-Data regarding the amount spent
-The graph depicts a relationship
Unlock this Answer For Free Now!
View this answer and more for free by performing one of the following actions

Scan the QR code to install the App and get 2 free unlocks

Unlock quizzes for free by uploading documents