Solve the problem.
-Data regarding the amount spent by a government department is represented in the following graph. Find the change in amount spent for the years shown in the graph. Is the graph a straight line?
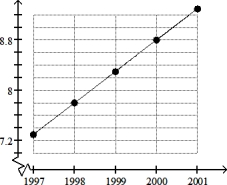
Year
A) Change for each year: $0.13 billion; yes
B) Change for each year: $0.33 billion; yes
C) Change from 1998 to 1999: $0.52 billion, change from 1999 to 2000: $0.13 billion; no
D) Change for each year: $0.52 billion; yes
Correct Answer:
Verified
Q105: Decide whether the slope is positive, negative,
Q106: Decide whether the slope is positive, negative,
Q107: Decide whether the slope is positive, negative,
Unlock this Answer For Free Now!
View this answer and more for free by performing one of the following actions

Scan the QR code to install the App and get 2 free unlocks

Unlock quizzes for free by uploading documents