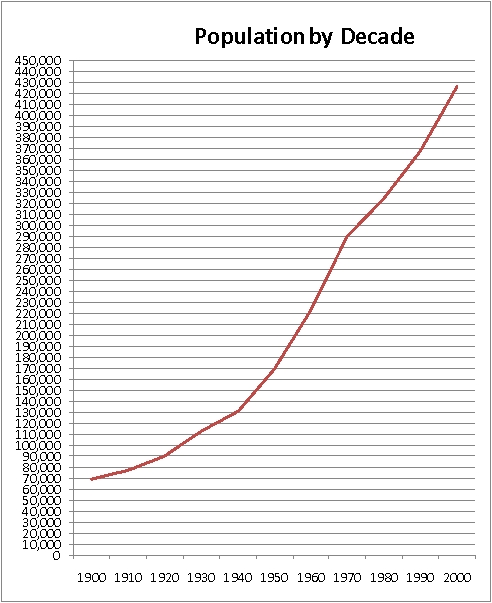
The graph below displays the population of the Madison, WI by decade.
Find:
A) The total change from 1940 to 1980. Round answer to the nearest ten-thousand.
B) The average rate of change from 1940 to 1980. Round answer to 2 decimal places if necessary.
Correct Answer:
Verified
View Answer
Unlock this answer now
Get Access to more Verified Answers free of charge
Q15: Find the average rate of change between
Q16: The table below gives a girl's height
Q17: In the first 8 years of his
Q18: A worker in a fast food restaurant
Q19: The graph below displays the population of
Q21: If the average rate of change is
Q22: If the average rate of change is
Q23: If the function is increasing, then the
Q24: If the function is decreasing, then the
Q25: Complete the sentence to describe the graph
Unlock this Answer For Free Now!
View this answer and more for free by performing one of the following actions

Scan the QR code to install the App and get 2 free unlocks

Unlock quizzes for free by uploading documents