The table below gives a girl's height (in inches) as a function of the child's age.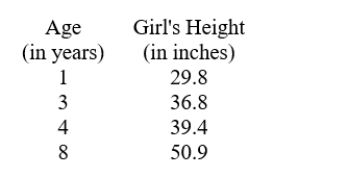 Use the data in the table and the average rates of change of height (in inches) to choose the best prediction for a girl's height (in inches) at age 10.
A) 56.84
B) 61.295
C) 53.87
D) 52.385
Correct Answer:
Verified
Q11: The table below is a data set
Q12: The table below is a data set
Q13: The table below is a data set
Q14: Find the average rate of change from
Q15: Find the average rate of change between
Q17: In the first 8 years of his
Q18: A worker in a fast food restaurant
Q19: The graph below displays the population of
Q20: The graph below displays the population of
Q21: If the average rate of change is
Unlock this Answer For Free Now!
View this answer and more for free by performing one of the following actions

Scan the QR code to install the App and get 2 free unlocks

Unlock quizzes for free by uploading documents