The graph below displays the population of the Madison, WI by decade.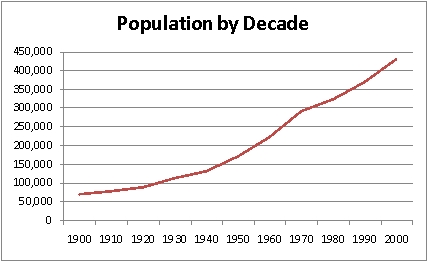
What would the units of the rate of change be?
A) People per thousand
B) Years per person
C) People per year
D) Years per thousand
Correct Answer:
Verified
Q14: Find the average rate of change from
Q15: Find the average rate of change between
Q16: The table below gives a girl's height
Q17: In the first 8 years of his
Q18: A worker in a fast food restaurant
Q20: The graph below displays the population of
Q21: If the average rate of change is
Q22: If the average rate of change is
Q23: If the function is increasing, then the
Q24: If the function is decreasing, then the
Unlock this Answer For Free Now!
View this answer and more for free by performing one of the following actions

Scan the QR code to install the App and get 2 free unlocks

Unlock quizzes for free by uploading documents