The following table shows the population of a state's eight most populated cities. 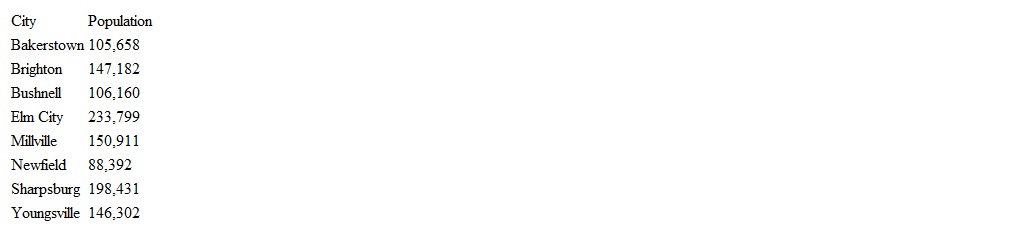 Construct a bar graph to display this data.
A) 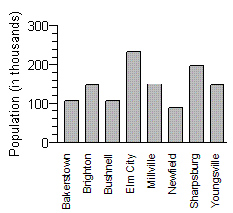
B) 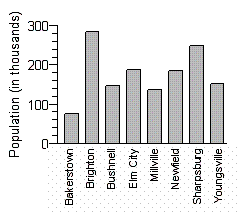
C) 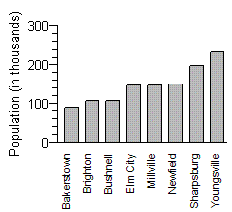
D) 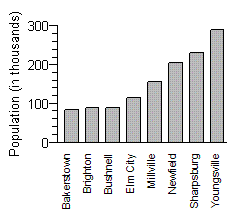
E) 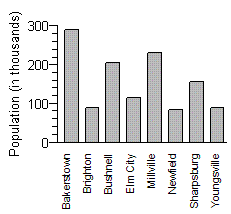
Correct Answer:
Verified
Q9: Beatrice has a 2.60 GPA after completing
Q10: The table below shows the age of
Q11: The table below shows the immigration rates
Q12: The following table shows the highest education
Q13: The line graph below shows the average
Q15: A consumer research group purchased identical items
Q16: The data below represents the distance, in
Q17: The table below shows the breakdown of
Q18: The bar graph below shows the regions
Q19: The line graph below shows the average
Unlock this Answer For Free Now!
View this answer and more for free by performing one of the following actions

Scan the QR code to install the App and get 2 free unlocks

Unlock quizzes for free by uploading documents